Logistic Regression
Instead of predicting exactly 0 or 1, logistic regression generates a probability - a value between 0 and 1, exclusive.
Sigmoid Function
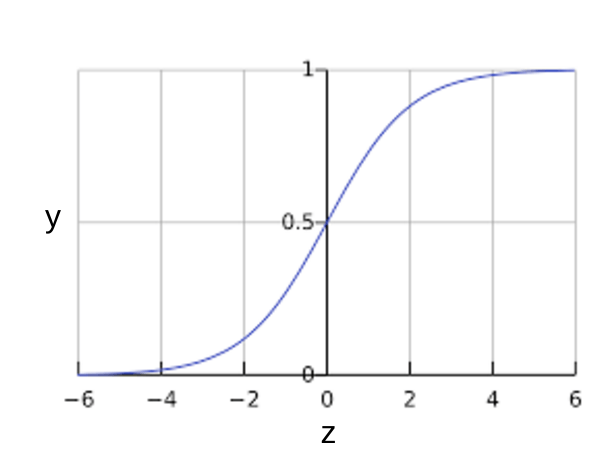
It’s defined as: $$ y = \frac{1}{1 + e^{-z}}$$
The sigmoid function yields the following plot:

Figure 1. Sigmoid
Loss Function for Logistic Regression
The loss function for linear regression is square loss. The loss function for logistic regression is Log Loss, which is defined as follows:
$$ \log loss = \sum_{(x,y)\in D} -y\log(y\prime) - (1 - y)\log(1 - y\prime) $$
where: - $ (x,y) \in D $ is the data containing many labeled examples, which are (x,y) pairs. - $ y $ is the label in a labeled example. Since this is logistic regression, every value of $ y $ must either be 0 or 1. - $ y \prime $ is the predicted value (somewhere between 0 and 1), given the set of features in x.
The equation for Log Loss is closely related to Shannon’s Entropy measure from Information Theory. It is also the negative logarithm of the likelihood function, assuming a Bernoulli distribution of $ y $. Indeed, minimizing the loss function yields a maximum likelihood estimate.
Regularization in Logistic Regression
Most logistic regression models use the following two strategies to dampen model complexity:
- L2 regularization.
- Early stopping, that is, limiting the number of training steps or the learning rate.
Summary
- Logistic regression models generate probabilities.
- Log Loss is the loss function for logistic regression.
- Logistic regression is widely used by many practitioners.
Note: Cover Picture
